Help us map Zambian buildings and #VisualizeNoMalaria


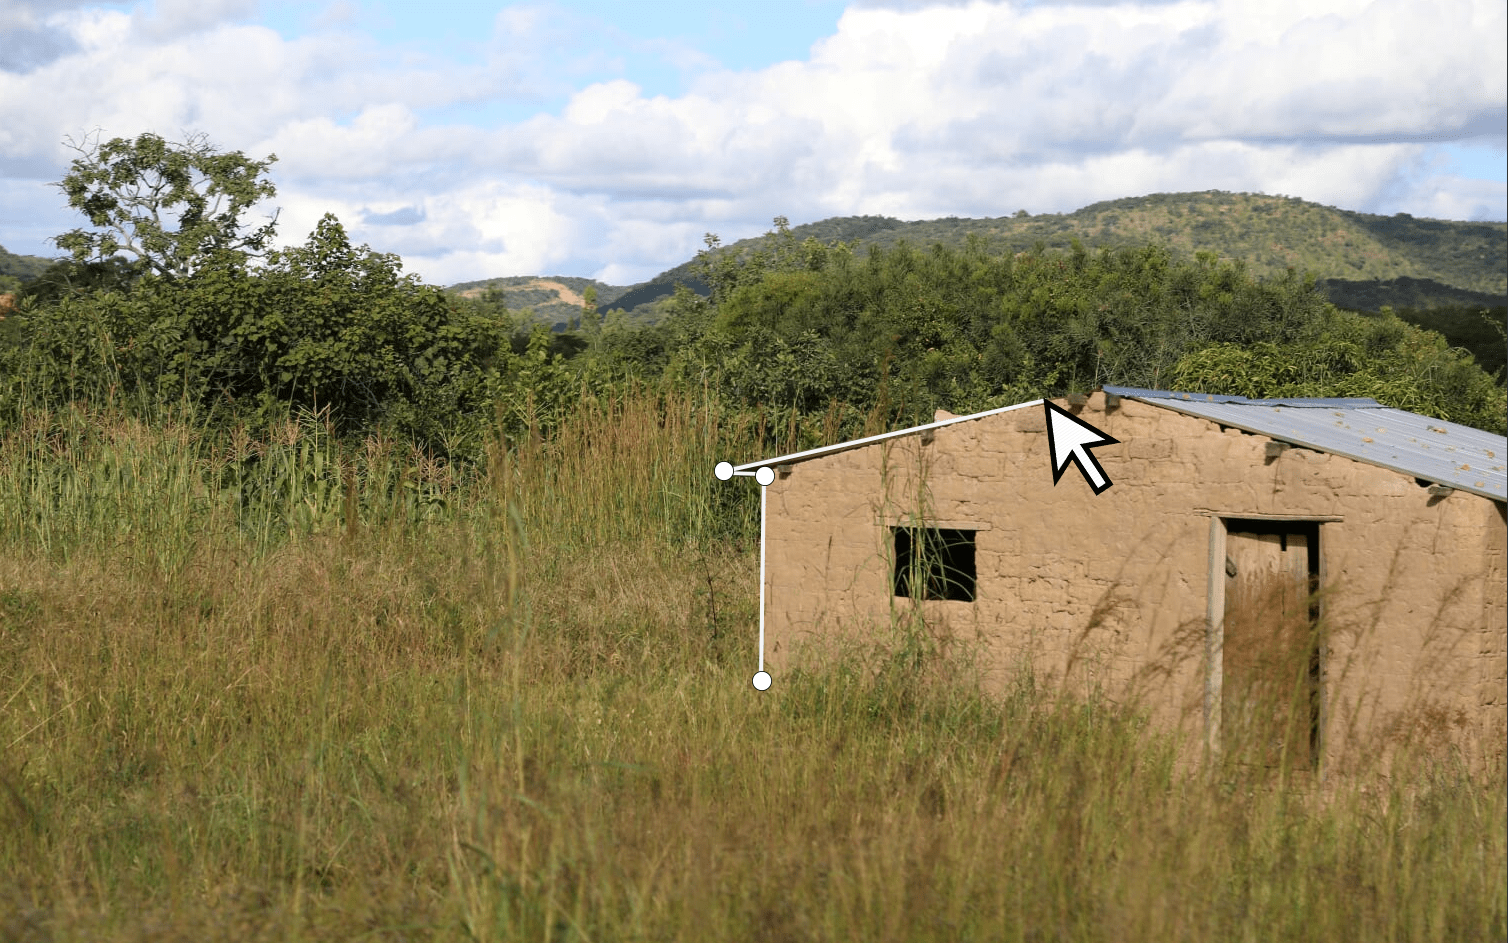
This photo shows a mud structure in a rural part of Zambia’s Southern Province. (Photo by Nelson Davis)
Last year, PATH, the Zambian government, and Tableau Foundation launched a five-year campaign to eradicate malaria in Zambia by 2020.
The team has already made tremendous progress. As of April, data showed the efforts of Zambia’s Ministry of Health had already achieved a 93 percent reduction in reported cases since 2014! We find ourselves at an ideal moment to move from a strategy of malaria control to a strategy for malaria elimination.
And now we need your help. Join us in our fight against malaria by helping map buildings in Zambia.
Maps and geospatial data are playing a crucial role in this project. They’re helping us visualize where resources are relative to incidence hot spots.
The next step involves predictive modeling. With a significant contribution from our friends at Alteryx (through their Alteryx for Good program), we’re working at the intersection of geospatial data and predictive modeling to see and understand the situation. We’ll be able to explore factors like topographical wetness, elevation, population movement, and density trends—all using custom shapes.
This data can help Ministry officials make choices about effective resource deployment and give community-health workers actionable information to work with.
But we can’t build out these resources alone. We need your help.
In creating our maps, we started with satellite imagery provided by Mapbox. Then we added custom-shape layers of Zambian provinces, districts, and facility Voronoi.
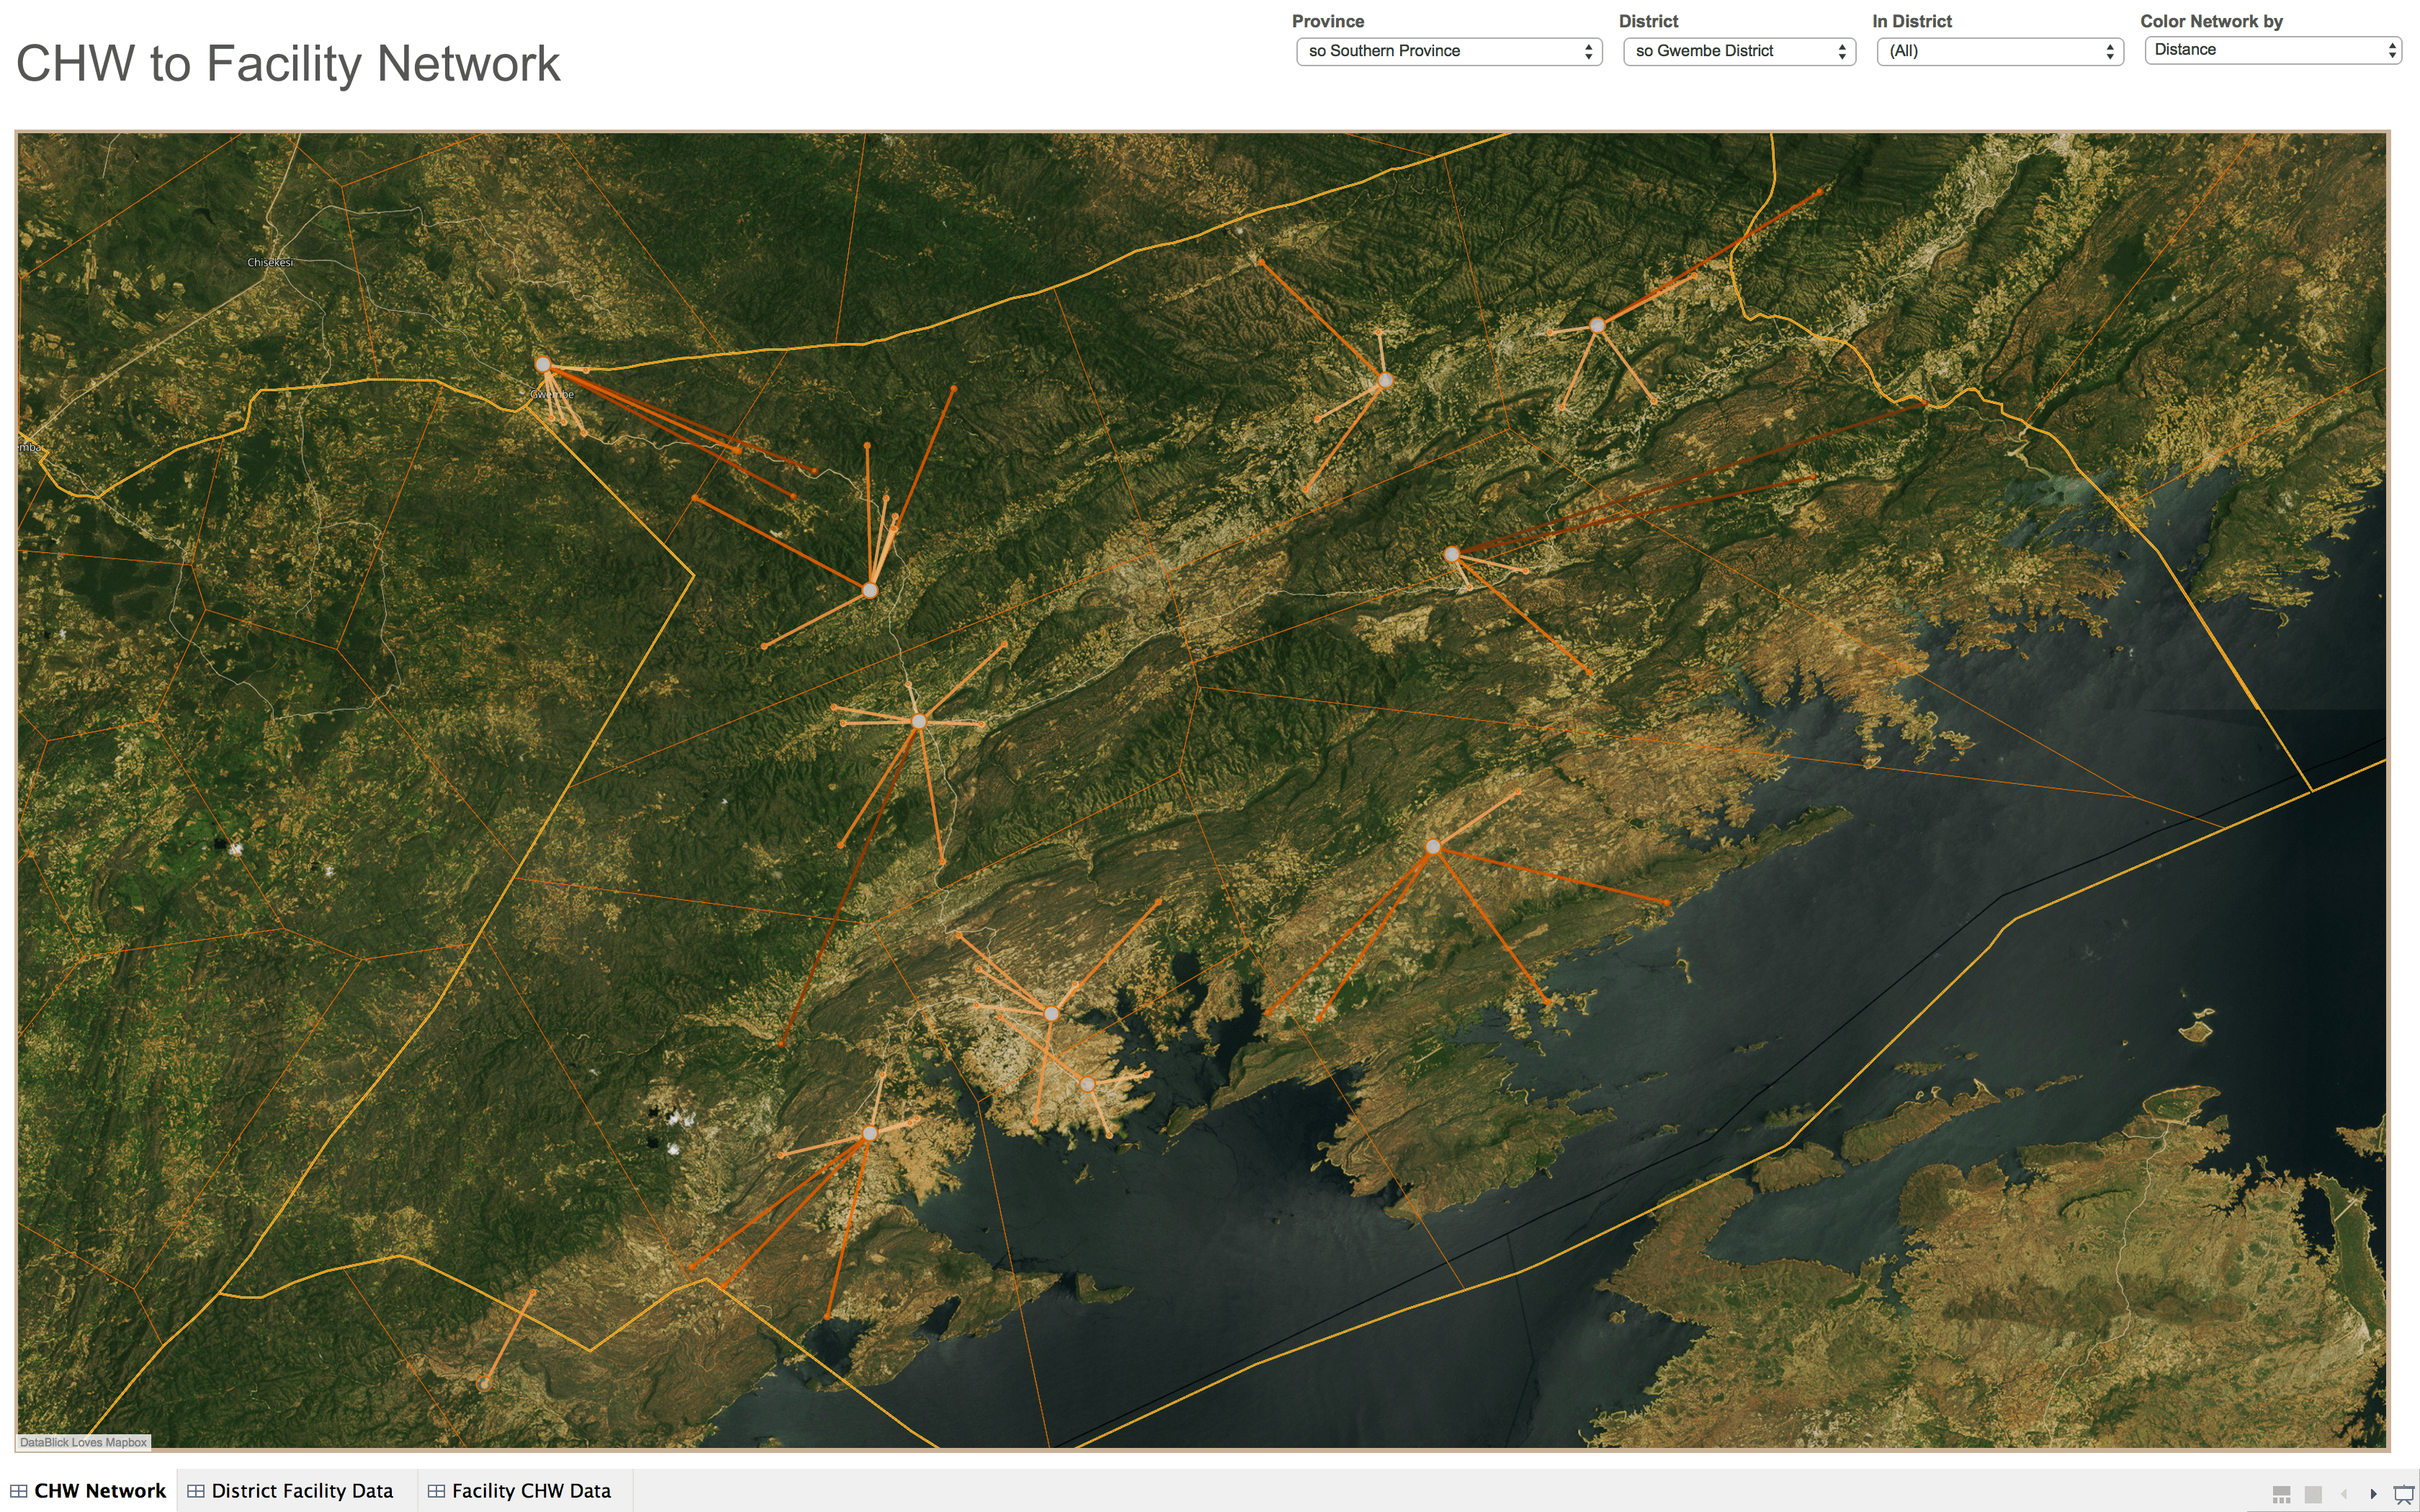 This sample Tableau dashboard uses Mapbox satellite imagery with custom-shape layers for Zambian districts. It also shows hub-and-spoke representation of community-health workers and their distance to the health facility they report to.
Now with help from Mapbox, we’re developing maps that improve our understanding of the existing topology—both the natural and man-made structures that are hospitable to malaria. The team can use this information to respond quickly with medicine to follow up and treat individual malaria cases. The team can also deploy resources such as indoor spraying and bed nets to effectively protect families living in the immediate vicinity.
Here is an example of a map of Livingstone, Zambia, extracted from OpenStreetMap and converted into Tableau:
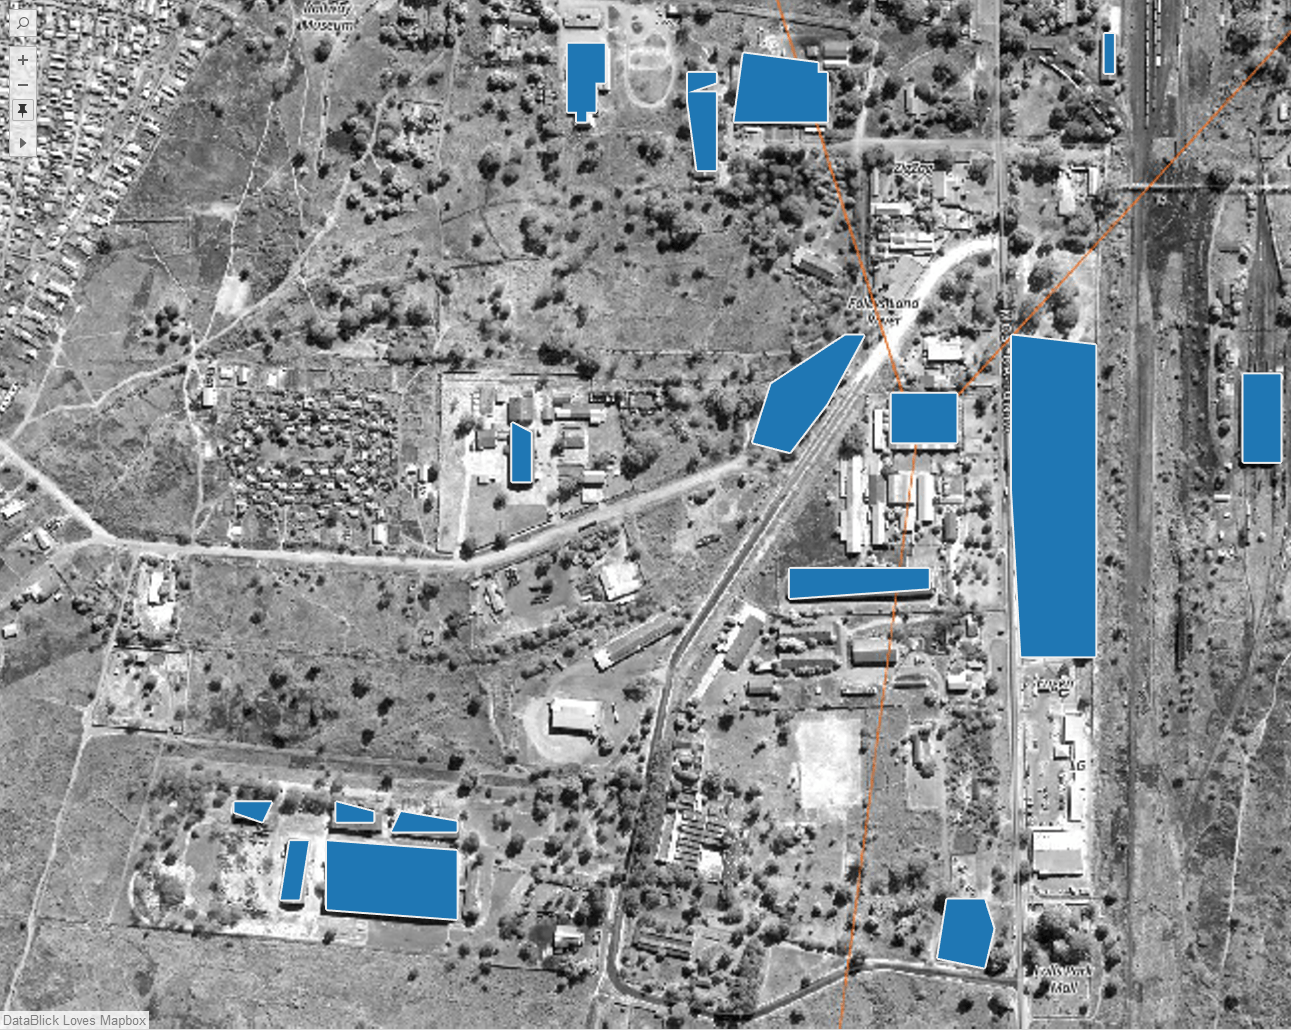
As you can see, the map isn’t complete. We have some work to do in order to reach household-level granularity.
This is how you can help the cause. Using iD editor, which allows anyone to edit OpenStreetMap,
you can trace buildings in Zambia’s Southern Province. This level of detail will play a major role in helping Zambian community-health workers hunt down every last case of malaria and wipe it out once and for all.
Follow these steps to join us in our fight.
1. Sign up for an account
First, sign up for an account. Then click the “edit” button to open OpenStreetMap's iD editor. A short interactive tutorial will walk you through the basics of mapping. For starters, here are some things to remember:
- Only map current and real things present on the ground
- Don't copy data from anywhere unless you have permission
2. Join the Zambia Mapping Project
The HOT OSM Tasking Manager is the global-mapping collaboration tool for humanitarian purposes. It divides areas into separate grids squares, and allows mappers to lock the grid they’re working on to avoid overlap.
Follow these steps to use the Tasking Manager:
- Open the Livingstone District project and log in with your OpenStreetMap account
- Read the instructions, then click “start contributing”
- Click on a task area you wish to work on, and click “start mapping” to assign yourself the block
- Click “edit in iD editor” to open the area in the map editor
3. Map missing buildings on OpenStreetMap
You can map missing buildings on the map using the simple iD editor.
Draw the shape, choose the building preset, and square the corners of the building.
- Click the area tool and trace the visible building from the satellite imagery. Double-click to finish drawing
- If the building is rectangular, square the corners from the editing menu (or press the S key)
- Once the feature is selected, choose the building category to mark it as a building
Remember to save frequently! When editing from the Tasking Manager, you will have a preset comment (for example, “tracing buildings and roads for #hotosm-project #MappingZambia”). When you are finished mapping, return to the Task Manager and click “stop mapping” to unlock this task square for others to edit, or mark task as “done” to submit it for review.
If you’re an experienced mapper, you can use the JOSM desktop map editor to make much larger contributions. Use these mapping guides to get started with using JOSM.
Thank you!
Thank you so much for taking the time to help us in our efforts. On behalf of the Zambian Ministry of Health and PATH, we’d also like to extend a heartfelt thank you to our friends at Mapbox, Alteryx, DataBlick, InterWorks, and Slalom who have all contributed their time, software, and talents to the effort.
And we want to say a special thanks to the several Zen Masters, past and present, who are all volunteering their time to create powerful new visualizations to help in the fight.
Related Stories

Using data to drive conversations about climate change
 April 28, 2022

Leveraging data to improve forestry practices worldwide

Doing Good Data Means Doing No Harm
 December 13, 2021
Subscribe to our blog
Get the latest Tableau updates in your inbox.