Get a taste of Iron Viz at Tableau Conference 2019


As humans, we have several basic needs, including the need for food, but throughout human history, food has become more than a simple commodity. Food—and how it’s consumed, grown, and purchased—can be a reflection of culture, geography, and socioeconomic status, making food data both complex and irresistible.
Speaking of things that are irresistible and topical, Tableau Conference 2019 (TC19), our annual customer conference, is currently underway in Las Vegas with tens of thousands of attendees craving the juiciest data entree of them all: the Iron Viz championship. For those of you who are new to Iron Viz, this is a fierce data competition unlike any other. Since its inception in 2011, we’ve received over 1,000 stunning submissions. Each year, the virtual, global-qualifier competitions determine the three finalists who take the big stage at TC19 to battle it out in front of an audience of thousands.
Our three contenders this year, Hesham Eissa, Lindsey Poulter, and Joshua Smith, will be competing live on Wednesday, November 13 at 5:30p.m. PST to create the best visualization in 20 minutes. Later in the blog, learn about each finalist and how their qualifying visualization beat other entries to become the cream of the crop. All three contestants are required to use the same data set and—for the first time ever—we want to give Iron Viz fans a chance to see the data before the show.
Our Iron Viz 2019 data sponsors, Pitney Bowes, have cooked up a delectable challenge. We’re excited to announce that the theme for the 2019 Iron Viz championship is… food data! No matter how you slice it, this is guaranteed to be a sizzling show that you don’t want to miss. We hope you’re hungry because this is just a taste of what our contestants will serve up at tomorrow’s competition.
Announcing a delicious data set from Pitney Bowes
Food Data—a delicious data selection from Pitney Bowes’ World Points of Interest & Demographics Data: Now this is one tasty data set. Courtesy of our sponsors, Pitney Bowes, the 2019 Iron Viz contestants will crunch data from restaurants and food stores around the world. This eight-million-row data set features hundreds of food-related categories, from Thai restaurants to pizzerias, butcher shops to supermarkets, and pastries to veggies. Will our vizzers specialize in one artisanal data course or will they use everything in the data pantry? Bring your appetite for beautiful, informative vizzes to TC and find out!
Take a crack at the data set and see what you can whip up! Download a slice of the data at the Pitney Bowes Software and Data Marketplace by registering an account. Please note that this extract only contains food data from the capital cities in 13 countries and that the data set used by finalists contains information on every city, town, and village within each country. Additionally, contestants can choose to combine their analysis with Demographics Data provided by Pitney Bowes. Finalists were given approximately three weeks to build their visualizations. Now, we challenge you to download the data and see what you can create. Don’t forget to share your viz on Tableau Public.
Get to know the 2019 Iron Viz contestants
To introduce the winners of each Iron Viz global qualifier competition, and share the viz that earned each of them a place in the championship, please meet the 2019 finalists: Lindsey Poulter, Joshua Smith, and Hesham Eissa.
Lindsey Poulter
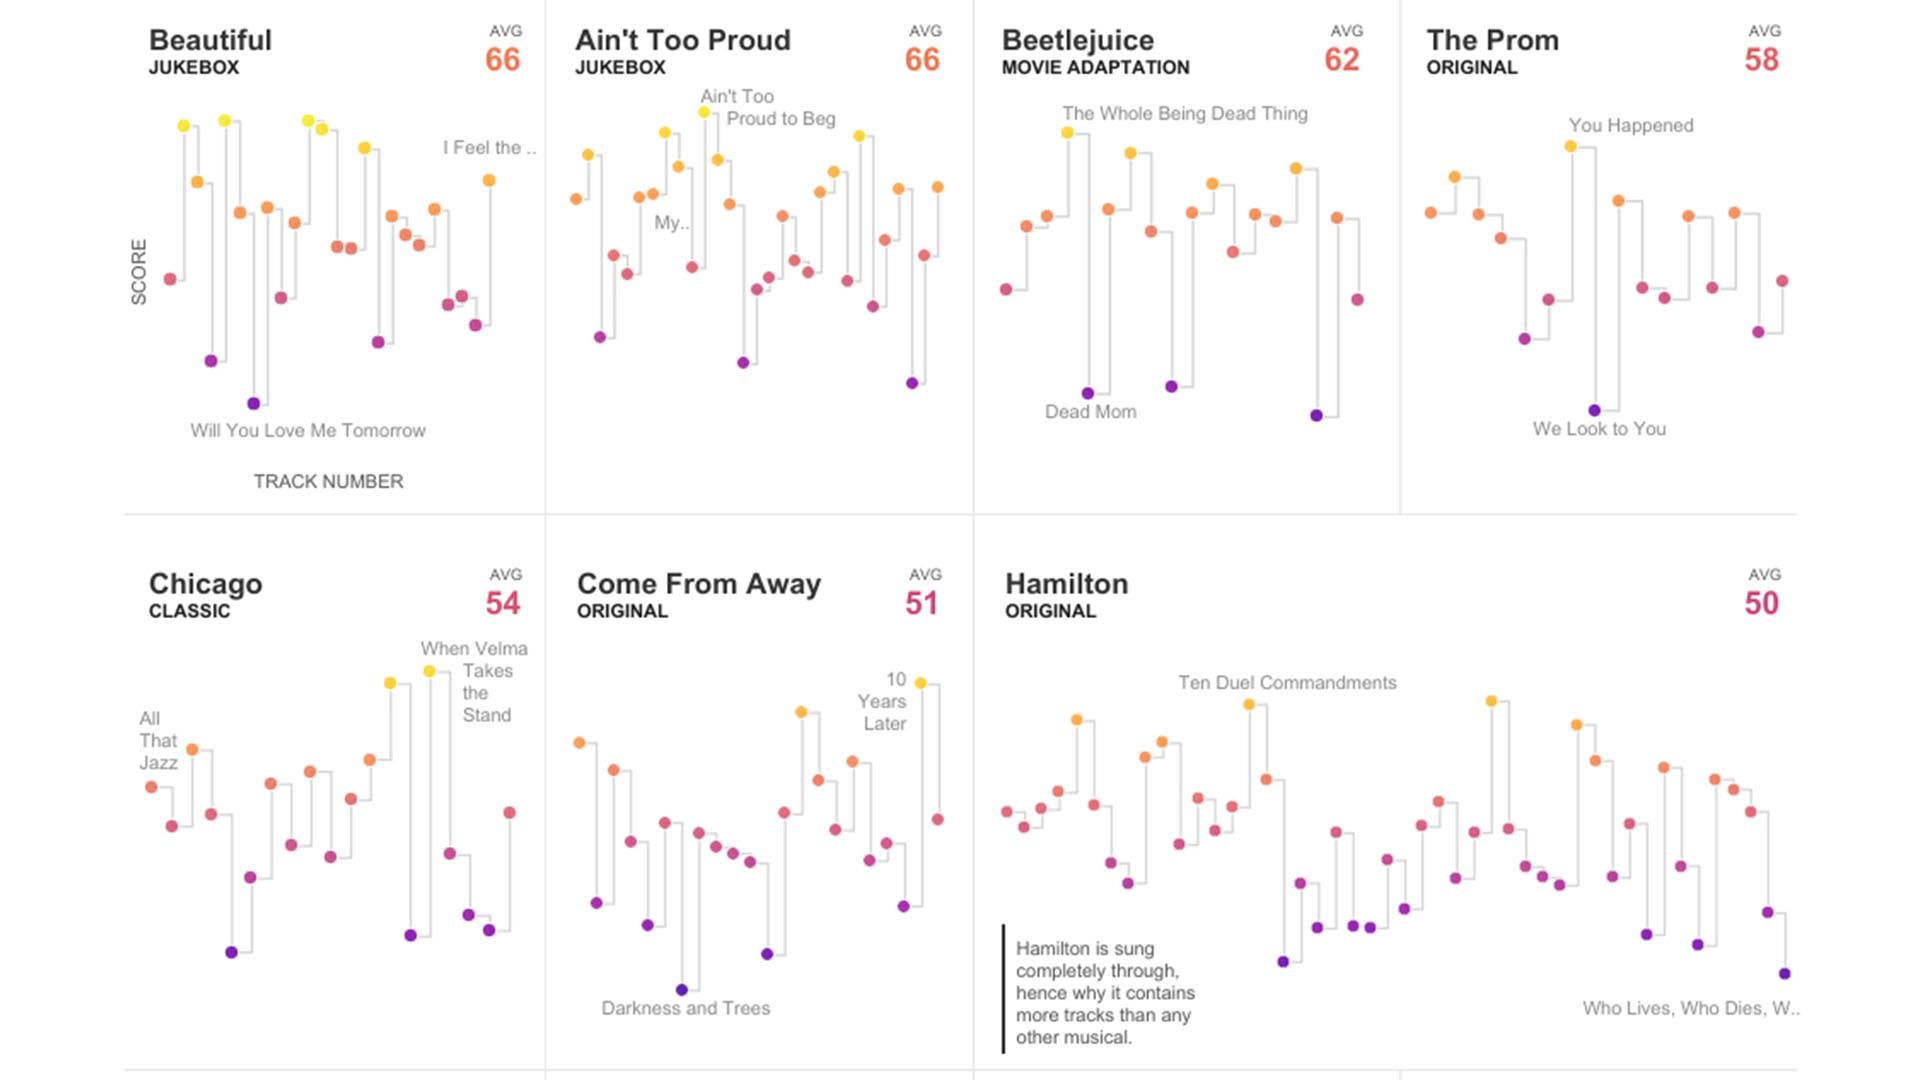
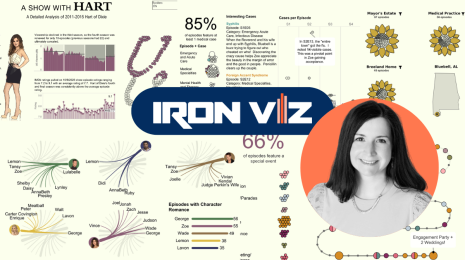
Lindsey Poulter is a data visualization and Tableau enthusiast. She has been using Tableau for 5 years and has worked across various industries, ranging from pharmaceutical marketing to financial software. Lindsey’s visualization for the global qualifier on music data explores the emotional valence of Broadway musicals. Her use of step charts to visualize the range of emotions projected by characters in each musical wowed the judges. Lindsey’s visualization tells an engaging, data-driven story that is easy for people to understand. See Lindsey’s concoction that wowed the judges:
Joshua Smith
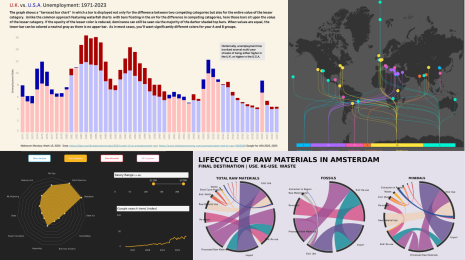
Joshua Smith grew up in a forest in Ohio and later moved to the “big city” of Columbus, Ohio, where he lives with his wife and son. Nearly a decade ago, Joshua was diagnosed with IBD. Through the struggles of his illness and managing his healthcare, Josh developed a passion for using analytics and Tableau to improve healthcare for patients just like himself. For the global qualifier competition on agriculture data, Joshua created a long-form visualization to compare the ways land is farmed. His minimalist yet granular approach, simple color scheme, and use of diverse of chart types landed him a spot on the Iron Viz stage. Check out the gourmet visualization that landed Joshua a spot on the Iron Viz stage:
Hesham Eissa
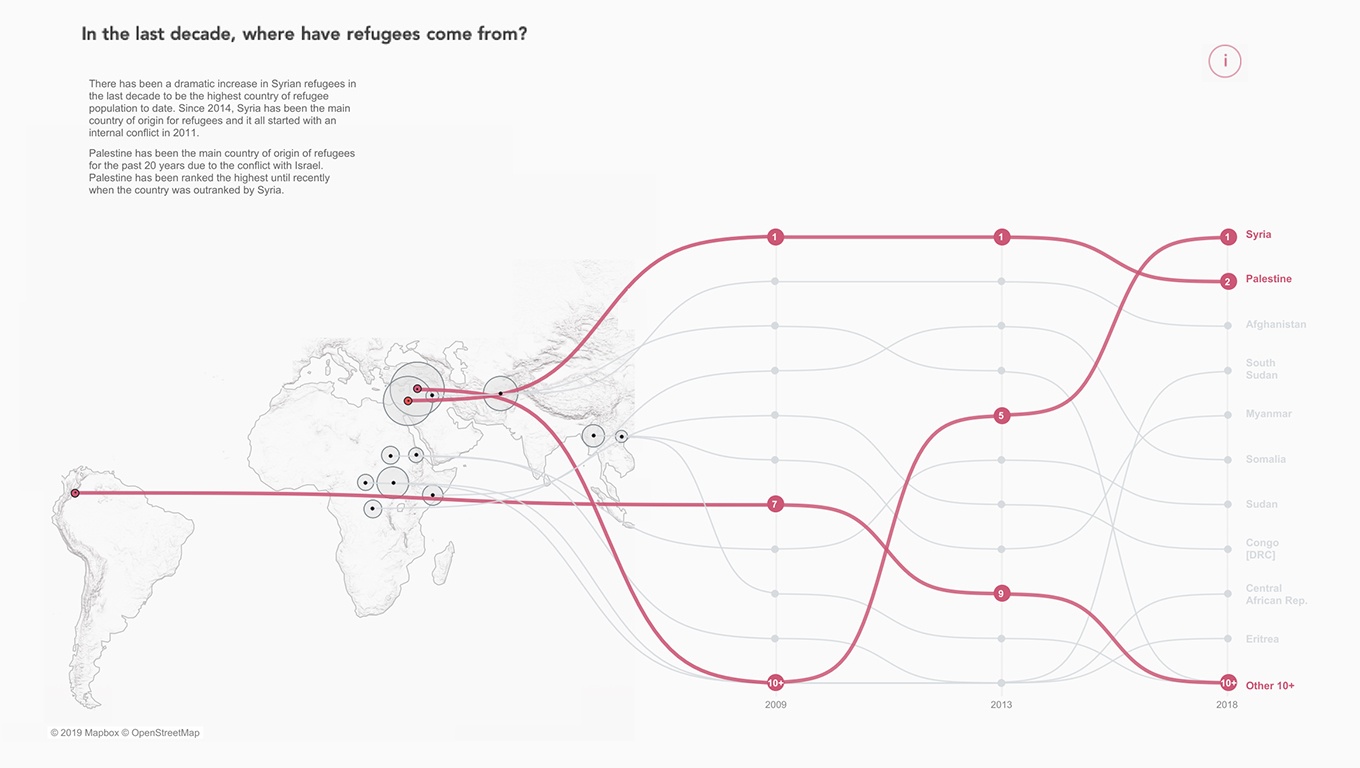
Hesham works as a consulting analyst at The Information Lab. He has been using Tableau for less than a year. After finishing his own training, he started helping clients visualize and understand their data. For the global qualifier on migration data, Hesham visualized the journey of refugees. Hesham’s visualization has it all—from bar charts to BANs, slope charts to Sankey diagrams, and step charts to heat maps. By including carefully chosen quotes from real people, Hesham was able to humanize the story behind his viz. Explore Hesham’s tasteful creation:
Tomorrow evening, these data rockstars will go head-to-head onstage at #data19 in Las Vegas. Whose viz will reign supreme? Tune in to find out.
Learn how the judging works
Each contestant’s score will be determined by two components: the Judges’ Score and the Audience Score.
The Judges’ Score
The 2019 Iron Viz Championship judging panel is formed by Vice President of Product Development, Ellie Fields, Tableau Technical Fellow, Jock Mackinlay, Tableau Zen Master and Tableau Public Ambassador, Chantilly Jaggernauth, and reigning Iron Viz Champion, Timothy Vermeiren. Each visualization will be scored by the judging panel on the following criteria:
- Design: How appropriate is the design for the story that is being told?
- Storytelling: Is there a clear story being told or question being explored, and is there appropriate context?
- Analysis: How sophisticated and appropriate are the chart types and data analysis methods being used in the visualization?
Each category is worth a maximum score of 30 points. The panel will add up the scores received in each of the three categories to determine the final Judges’ Score. For example, the highest-possible Judges’ Score that may be awarded to an individual contestant is 90 points.
The Audience Score
We want input from you, the Tableau Community. That’s why we’re allowing the audience to cast their votes via Twitter. All you have to do is tweet using a contestant’s designated hashtag. Twitter voting will take place on Wednesday, November 13, 2019 from 5:30 p.m. PST to 6:15 p.m. PST.
After Twitter voting has closed, the number of Twitter votes received by each contestant will be counted. To apply the Twitter votes to finalist’s total score, a percentage of the total number of votes will equal a specific number of points. (For example, if 100 Twitter votes were received, with submission A receiving 25 votes (25%), submission A would receive a 2.5-point Audience Score.)
Please note, you can only vote on Twitter once. Duplicate votes will not be counted towards a contestant’s score. Although Twitter scores can help tip the scale, the Audience Score does not necessarily determine the winner. In other words, the Iron Viz Champion may not receive the highest percentage of Twitter votes. See the Official Rules and Rules FAQ for more information on the scoring process.
Don’t miss a moment with the Tableau Conference Livestream
Who will bring home the bacon? We can’t wait to see what the finalists will cook up! Join us on Wednesday, November 13th, at 5:30 p.m. PST to witness the Iron Viz contestants battle it out live in front of thousands. Can’t make it to #data19? We’ve got you covered. Watch a livestream of the Iron Viz Championship here— don’t forget to grab the popcorn!
Related Stories
DataFam Roundup: April 15–19, 2024
 April 19, 2024
Meet Iron Viz 2024 Finalist Jessica Moon
 April 15, 2024
DataFam Roundup: April 8–12, 2024
April 12, 2024
Subscribe to our blog
Get the latest Tableau updates in your inbox.