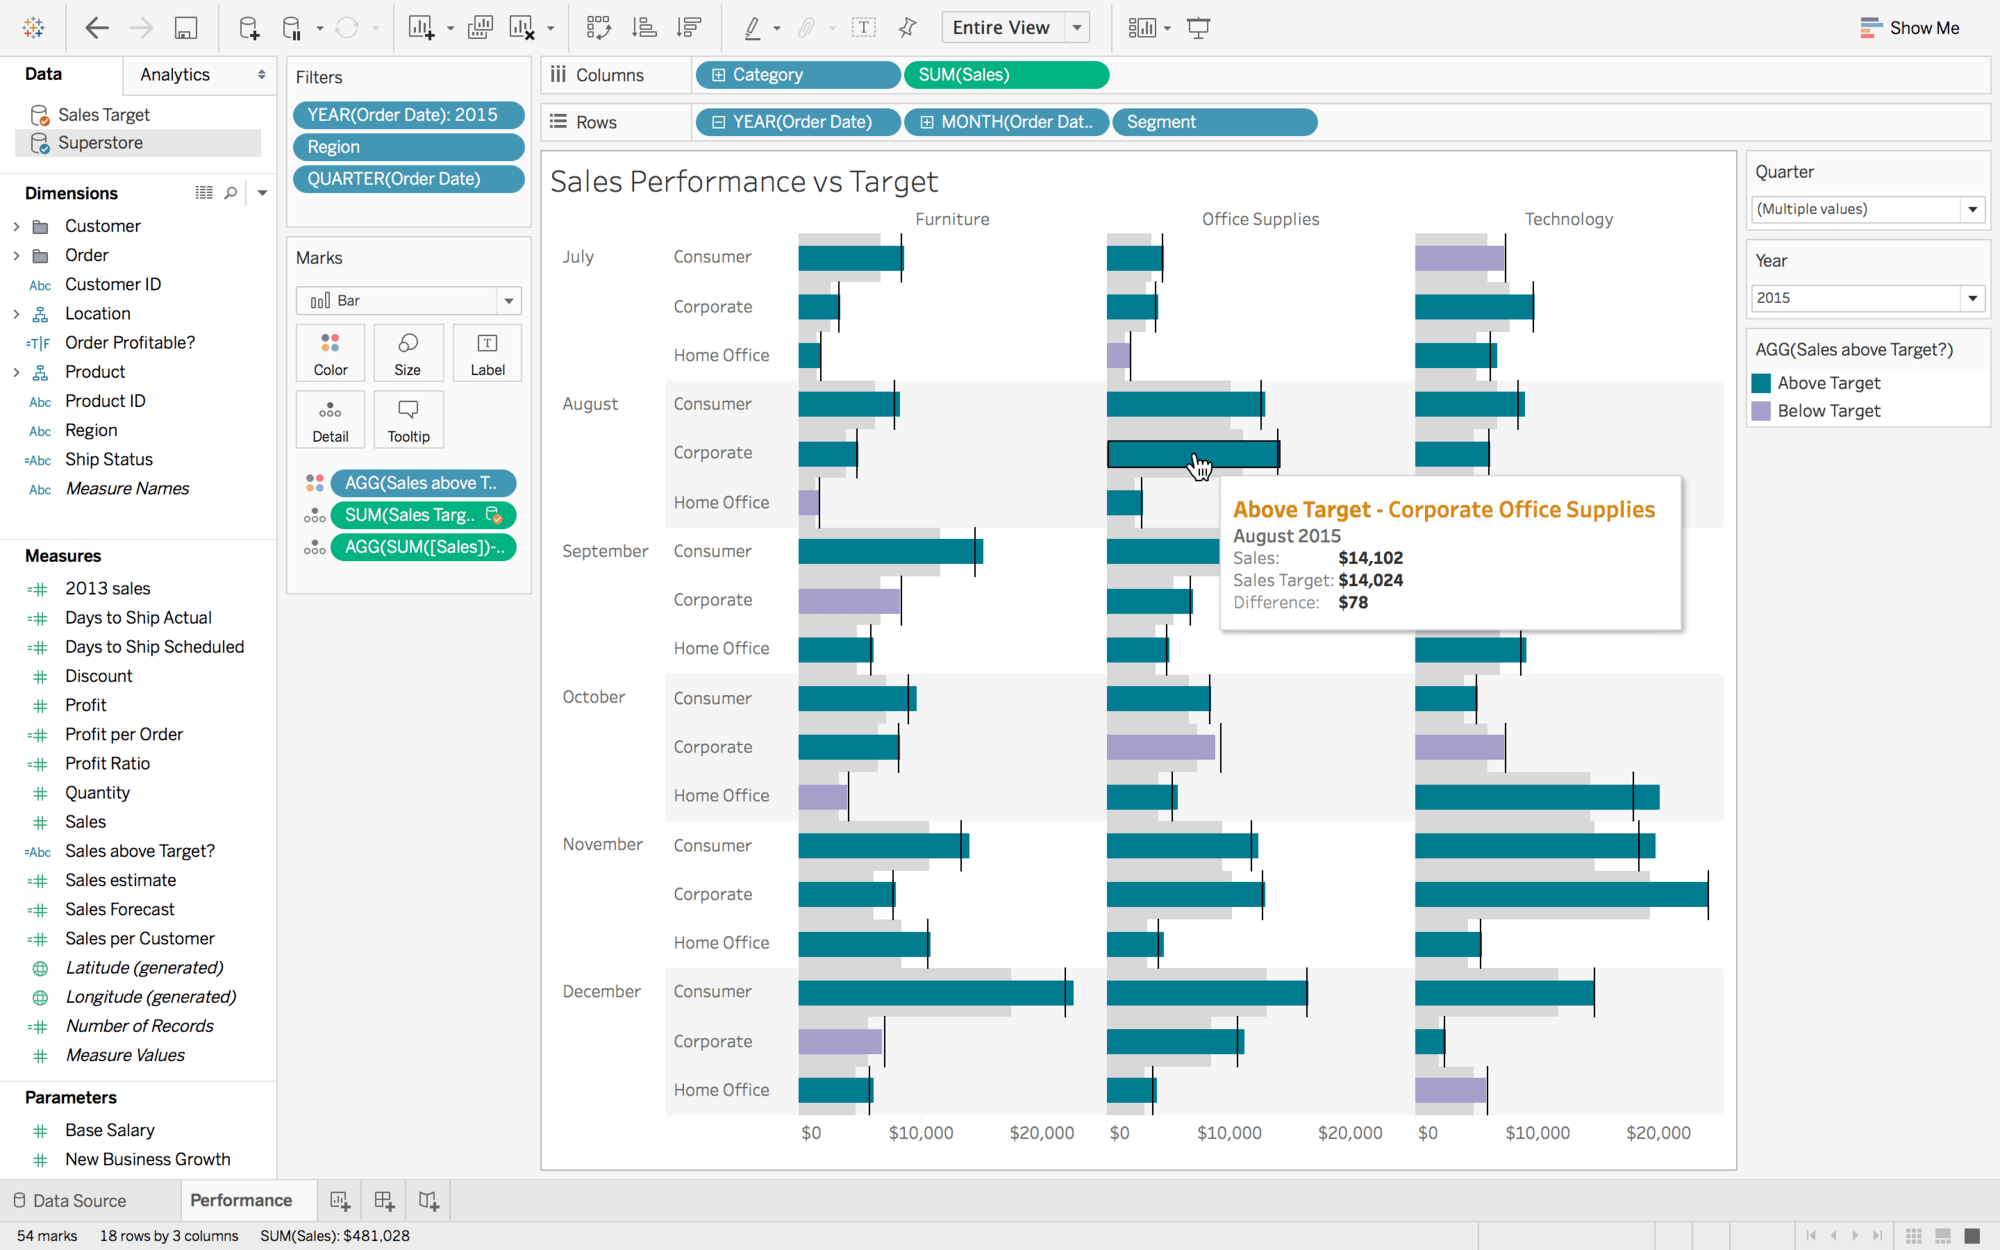
Excel is everywhere. It's the go-to analysis tool and spreadsheet software for many business users. With Tableau, it’s even more powerful. With a drag-and-drop approach to visual analysis, Tableau makes exploring Excel data faster and easier. You can ask and answer questions as you go, instead of running separate reports or cross-tabs for every question. Tableau visualizations are interactive and highly shareable, helping everyone in your business get answers. Best of all, Tableau natively connects to Excel spreadsheets to make data analysis fast and simple. Tableau allows Excel users to keep their spreadsheets while greatly enhancing their ability to analyze their data, all while delivering simple to build, simple to read visualizations that convey information clearly.
Solutions
Excel
Tableau and Excel: A beautiful partnership
Connecting Tableau and Excel
Need a hand connecting Tableau to your Excel workbook? We've got you covered. Watch our short free training video to learn how to easily connect Tableau to your spreadsheets. But don't stop there, use our free tutorial videos to learn all sorts of ways to improve your analysis of data kept in spreadsheets.
Watch the video now
Overcoming Excel's hurdles with Tableau
People like to stay in their comfort zone. So when their work is full of spreadsheets, it's no surprise that moving to Tableau can require a shift in mindset. Luckily, being able to see your data helps make the move easier.
Our customers used to use Excel or other tools that aren’t adapted to data discovery like Tableau is. Now we can drag dimensions and measures, see if this or that visualization works, and optimize to get the insights we need. We easily iterate and don’t have to rely on a long development process. We can share with other employees, and this gives our customers a ‘wow’ experience, because they’re used to having reports built by an IT department—and now they can do it all themselves.