Tableau for Industries
Federal and defense analytics
Inform mission-critical decisions, drive operational agility, and improve service delivery with data

A data-driven approach to improving payment integrity
Agencies are leveraging data to quickly respond to crises and deliver critical economic relief and public services while remaining effective stewards of taxpayers' dollars. Hear how the U.S. Health Resources and Services Administration (HRSA) supported the Provider Relief Fund, authorized by the CARES Act, leveraging advanced analytics.
Watch now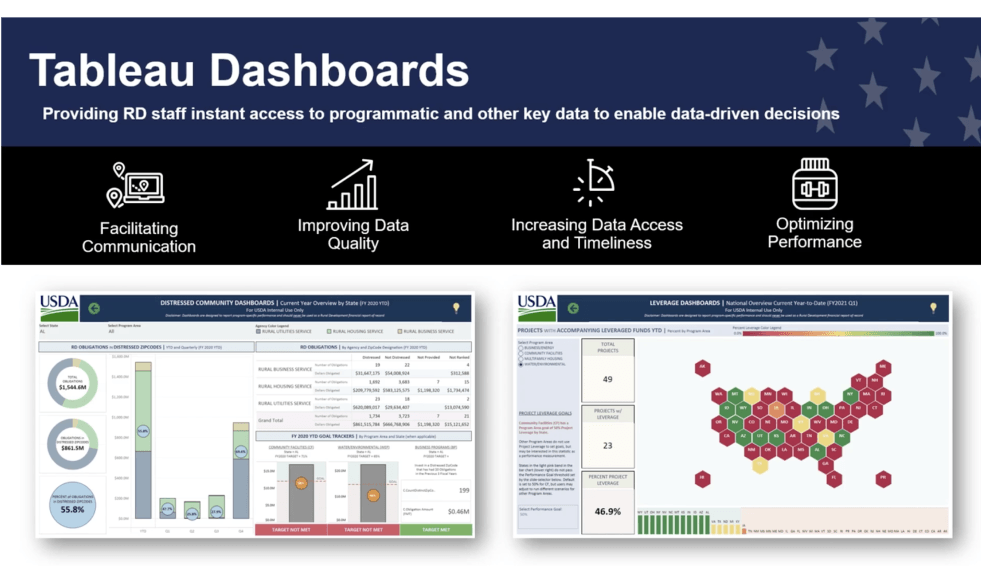
How data analytics can help support vulnerable communities
This on-demand virtual session from the Tableau Government Summit explores how USDA Rural Development used Tableau to identify vulnerable communities needing economic relief during COVID-19.
Watch nowWhen it comes to data, we are trying to create that single source of truth, facilitate performance and empower our stakeholders to drive new insights and inform decision-making.

Improving data sharing and helping to save lives
Learn how the US Agency for International Development (USAID) became a data-driven organization, using Tableau to meet 90 percent of its data needs—enabling it to carry out its life-saving work around the globe more effectively.
Read the story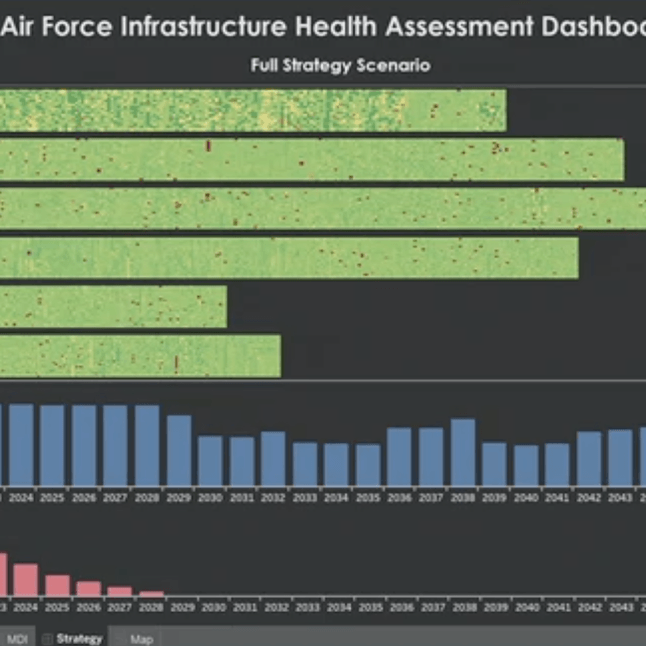
Modernizing through data
See how the U.S. Air Force used Tableau to create an analytical platform with a customizable front-end visual interface, enabling the branch to make better, data-driven decisions.
Watch the session
Future-proofing the workforce
Find out how the Australian Financial Security Authority used enterprise-wide self-service analytics and predictive modeling to reduce ad-hoc workforce reporting and minimize risk significantly.
Read the story
Additional
resources
Solutions
Featured Solution
Finance analytics for the public sector
Discover how Tableau enables public sector organizations to leverage robust data analytics that help improve regulatory compliance and reduce risk.
Find out more
Products and
use cases
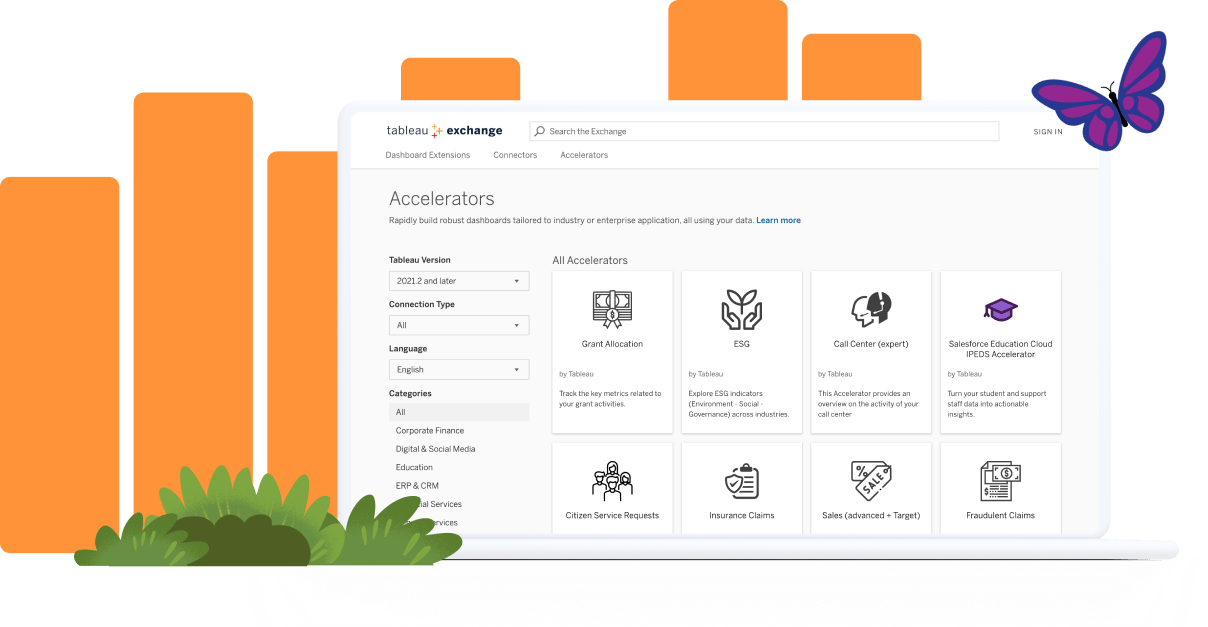
Jumpstart analysis with Tableau Accelerators
Get expert-built dashboards to address federal-specific business needs with Accelerators on the Tableau Exchange.
Visit the Tableau ExchangeExplore Tableau events

Tableau Partner Network
Need help solving your toughest data challenges? We’ve got you. With more than 1,200 partners—including resellers, services, and technology—it’s easy to get the right support for your business.
Find a partnerVisualize government data
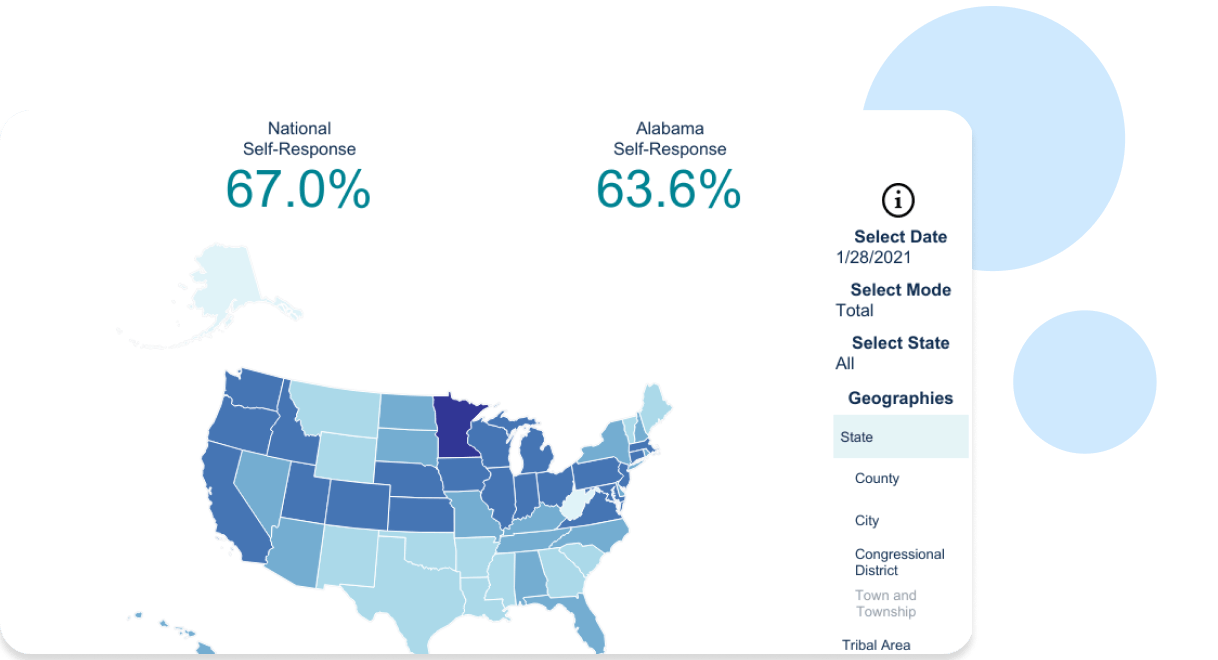
Explore nationwide 2020 US census engagement
This interactive data visualization allows users to quickly understand self-response rates in communities to encourage action before the collection deadline.
Explore the viz
Fraud and ID theft maps
This collection of data visualizations inform and protect American consumers with fraud and identity theft data reported by millions of people across the country.
Explore the viz
Salesforce and Tableau
A complete intelligence platform built on the world’s #1 CRM, Salesforce, CRM Analytics offers federal governments a native analytics experience. To boost productivity, Salesforce users can surface intelligent, actionable insights—right within their workflow. Explore Salesforce solutions for the government.