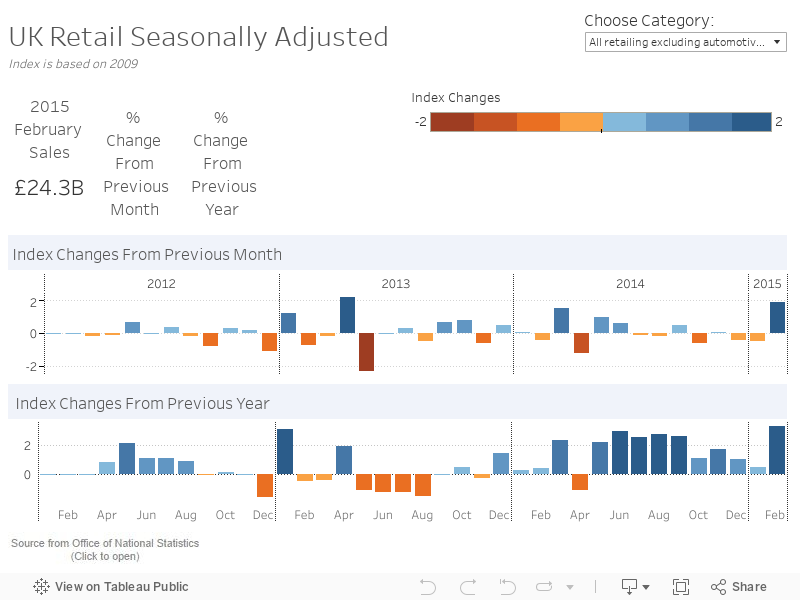
Track changes to the retail sales index to understand your industry
No matter which product segment you operate in, you probably have questions about your industry. This dashboard blends data from three different spreadsheets and lets you ask and answer questions at the speed of thought. The two bar charts give you an overview of index changes from previous months and year. The right-side panel shows the actual sales and percentage changes in the most recent month. Selecting product category in the filter window lets you see index changes in that particular product segment.