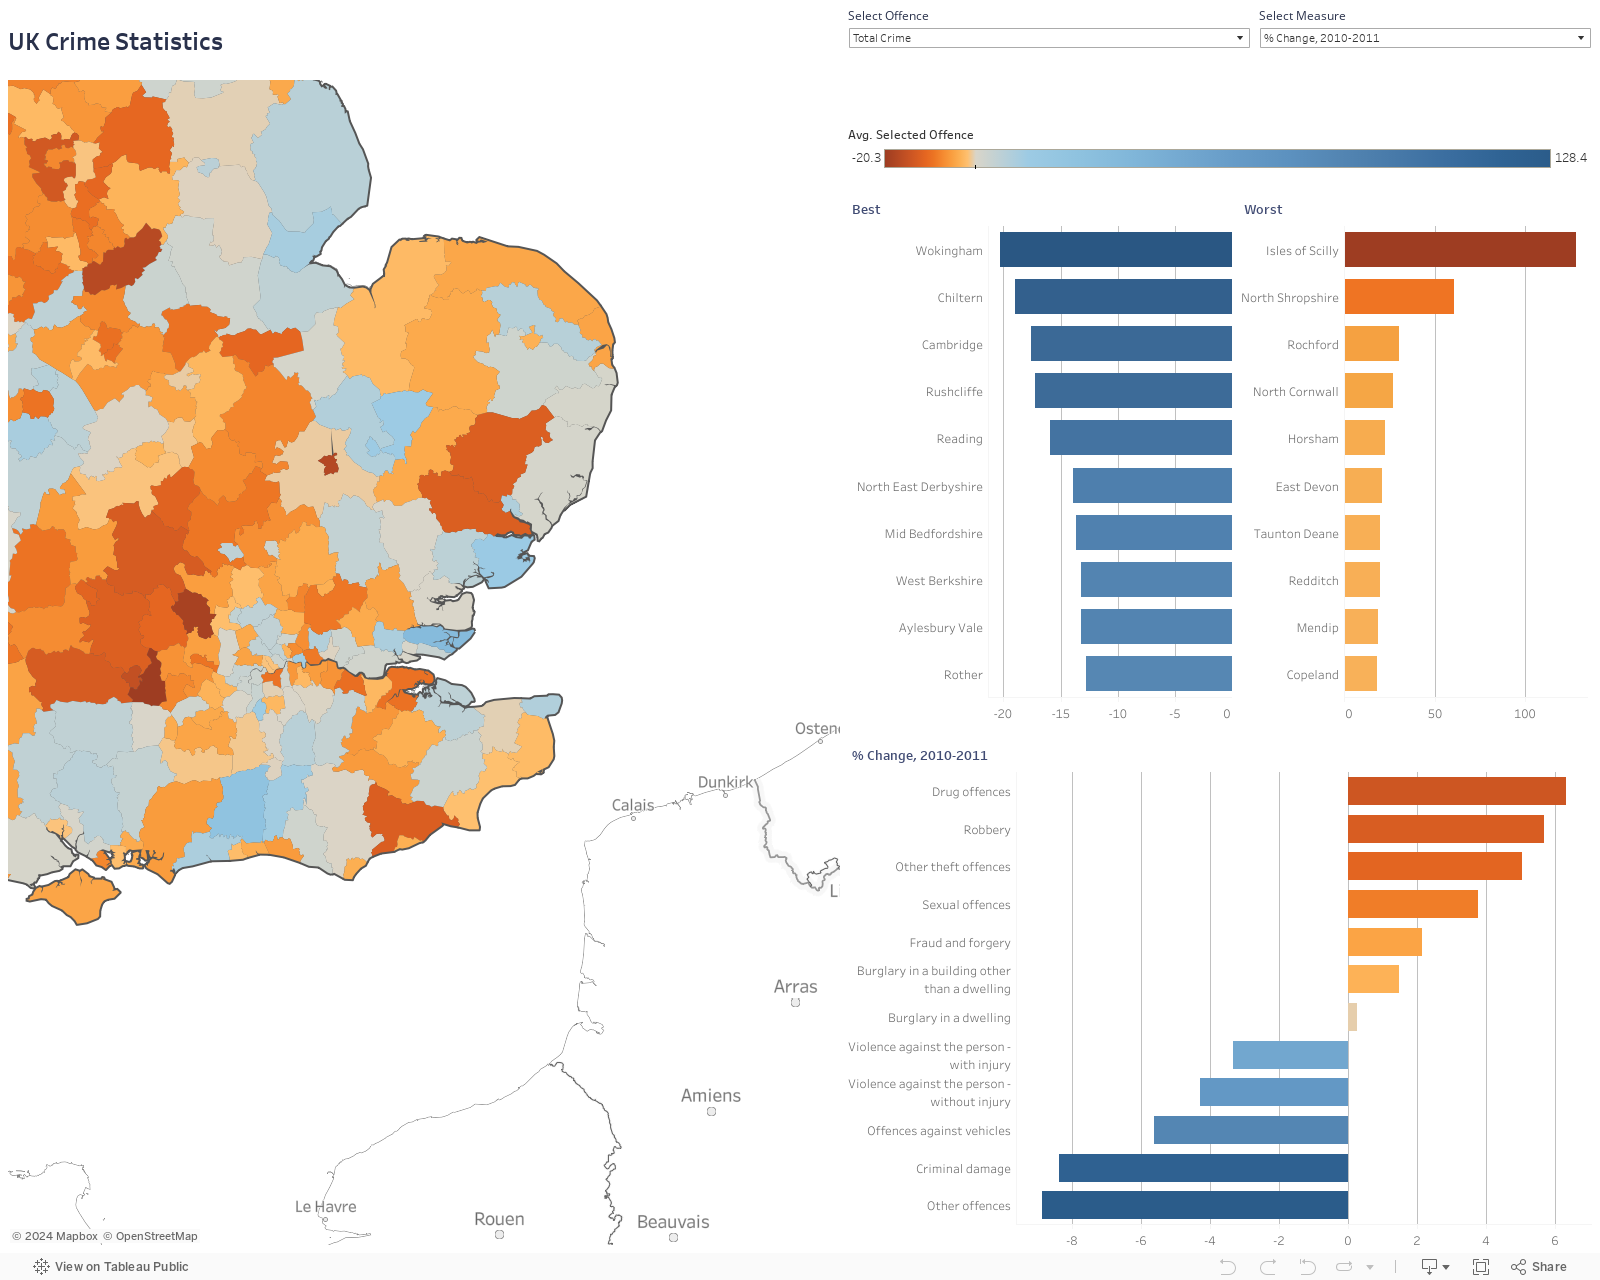
Dive deeper into local crime statistics
To truly be empowered, citizens need more than access to data; they need to see and understand the data. With Tableau, non-profits, journalists, and government workers can connect to interesting data sets to find trends and outliers in just minutes. This dashboard by Tableau Zen Master Craig Bloodworth visualizes UK crime stats from 2010 to 2011. Use the windows at the top to filter by offence or measure, or click on a neighborhood to zoom in.