Measuring Customer Satisfaction
Many businesses have survey data somewhere, waiting for better analysis. Using a survey containing ratings from 1 to 10, this analytical view correlates ratings of overall satisfaction, firm expertise, and likelihood to recommend for several customer segments. Each circle represents a segment defined by the combination of industry, job function, gender, and product. Size corresponds to the number of customers in that segment.

Create and share on Tableau Public
Join the newsletter and find daily inspiration with the Viz of the Day. Yours could be featured next!
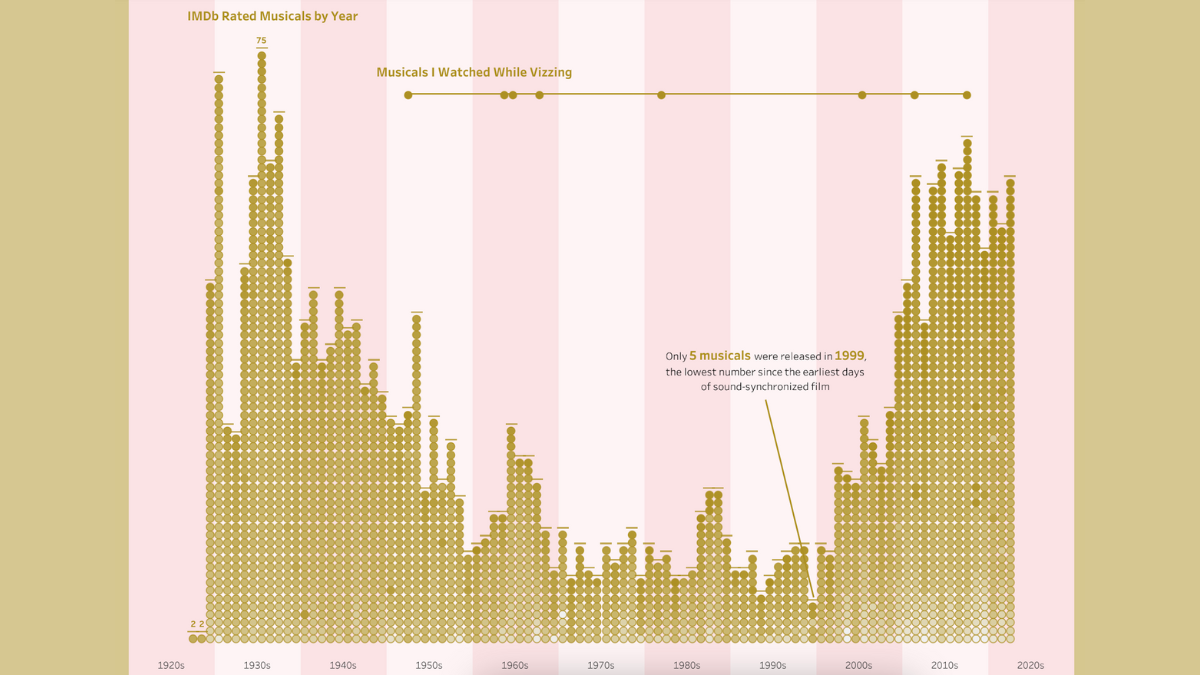
100 Years of Movie Musicals
Sing and swing through cinematic history with this #VizOfTheDay by Kimberly Furdell, Ph.D. Explore musicals by decade, and uncover insights such as ratings, actors, the percentage of musicals among all films, and more with this #DataPlusMovies entry.
Interact with the viz