Now available in Tableau 2022.2—Data Stories, autosave, in-product Exchange, Metrics and Prep enhancements, and more


The latest version of Tableau is now available for customers! Tableau 2022.2 delivers new capabilities that make data easier for everyone to use, including more efficient data prep and faster analysis. This release includes the first wave of product innovations announced at Tableau Conference 2022.
Let’s take a look at the 2022.2 highlights:
- Read about data insights. Generate automated natural language dashboard summaries with Data Stories to add context for business users.
- Find content faster. View suggested content and past searches in Tableau Cloud’s new Quick Search to save time and speed up time to insight.
- Track your most important data. Edit and transform existing Metrics into dynamic KPIs with historical comparisons, constant comparison with status, and custom date ranges.
- Build streamlined Prep flows. Simplify connections with expanded wildcard union options. Specify column order by drag and drop, maintaining it across the entire Prep flow.
- Jumpstart your analysis. Browse and use Connectors, Dashboard Extensions, and Accelerators directly in Tableau Desktop with the in-product Exchange.
- Autosave in the browser. Edit without fear of losing work, breaking things, or sharing prematurely. Tableau Cloud now stores existing workbook changes in an unpublished draft.
Upgrade to Tableau 2022.2 to take advantage of these features and more.
Now, let’s take a closer look at what’s in this release.
Read about data insights
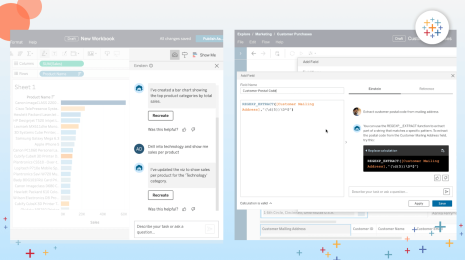
What does the data say? For business users, answering that question may be a barrier to data-driven decisions. To make data more approachable, deliver real-time insights in plain language with Data Stories.
Data Stories summarize key insights that anyone can read. The bulleted list provides the perfect complement to your visualizations—and they update as your data changes, even while interacting.
To get started, drop the Data Story object on your dashboard. Customize the inputs in a few clicks. And just like that, you’ll never write a dashboard summary again. These automated, plain-language explanations are available now in Tableau Cloud and coming soon to Tableau Server (currently in English only).
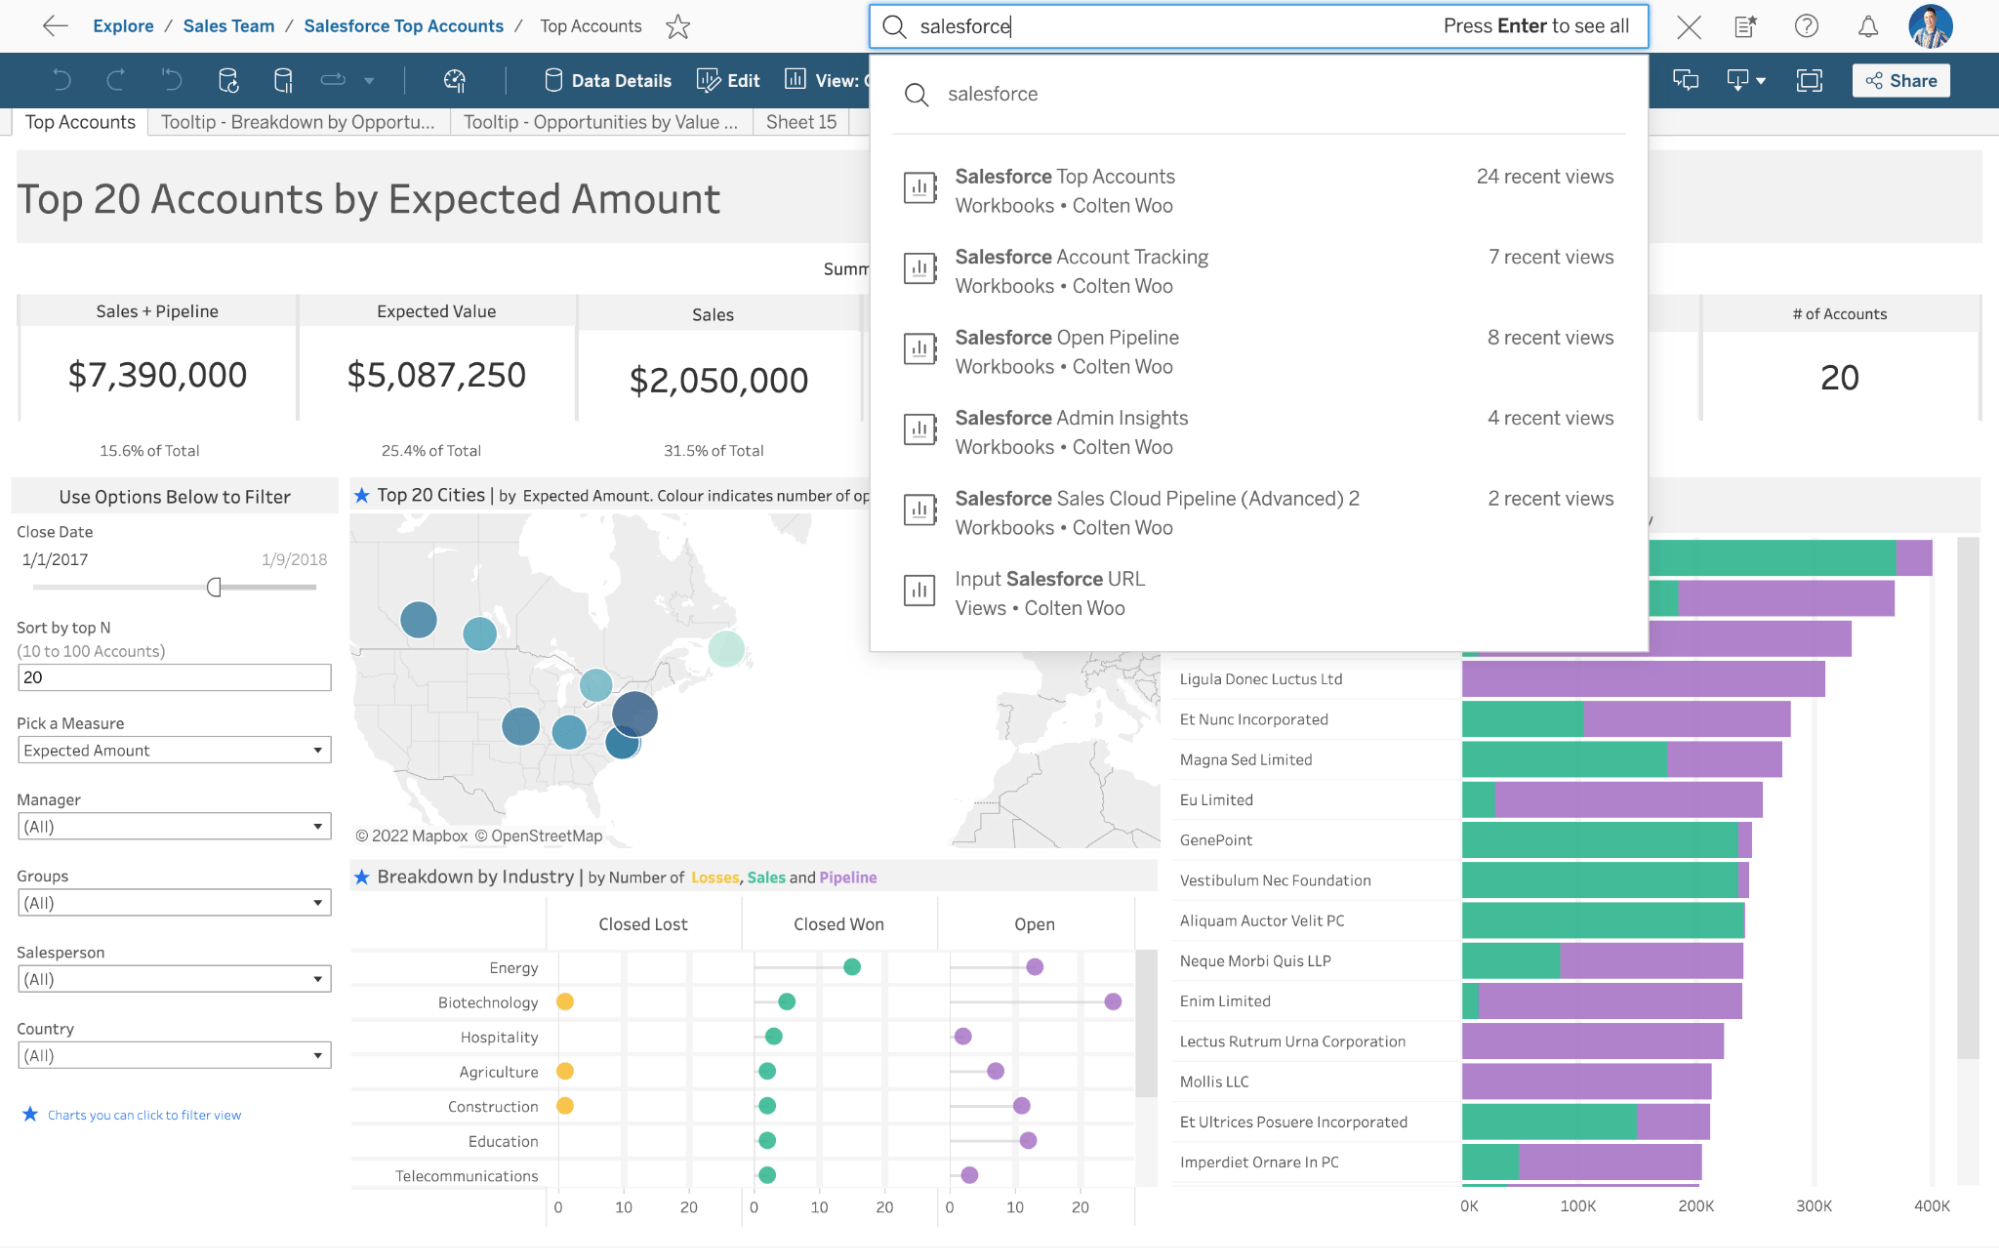
Find content faster
Not sure where to find the useful dashboard that you saw last week? Or maybe you’d like to search for related content.
Turn to the all-new Quick Search to view past searches and suggested content. You can access Quick Search from any page and review results within the search box—regardless of content type.
Your desired content is only a click away. Spend less time searching for your data and more time engaging with it. The new Quick Search experience is available now in Tableau Cloud and will be updated in Tableau Server later this year.
Track your most important data
Dashboards are great for viewing and interacting with your data. But sometimes you’re only concerned about a few key numbers.
Instead of combing through dashboards, you can track your most important data with Metrics. Metrics provide a fast and easy way to stay up-to-date with your data. Now, they are configurable in Tableau Cloud. Metrics are also available in Tableau Server with editing support coming later this year.
Open a Metric, click the pencil icon, and start experimenting. You can adjust the date range, comparison type, and comparison period. The preview updates while you fine-tune your configuration. You can also use the date window switcher to reveal more or less data without editing the configuration.
Build streamlined Prep flows
Many customers say they spend more time preparing data than analyzing it. Well, with Tableau Prep, you can reduce your data preparation time by 60%.
Use wildcard union to automatically discover and join tables based on search criteria. You have expanded options to include file name, file size, creation date, modification date, and access date.
These options equip you with the fine-grained control needed to programmatically select input files. You can also include these file attributes in your output to infuse additional context into your data.
As we’ve heard from our Tableau Community, you want to present your data in a specific order. Yet, exceptionally wide tables of data make reordering columns difficult and tedious.
To make this process more manageable, leverage the field list view. This view provides a condensed list of your data so you can quickly drag and drop to reorder fields.
Once you have specified the order, it is maintained across the entire flow and final output. With data in the order you expect, you can get oriented quickly at every step.
Jumpstart your analysis
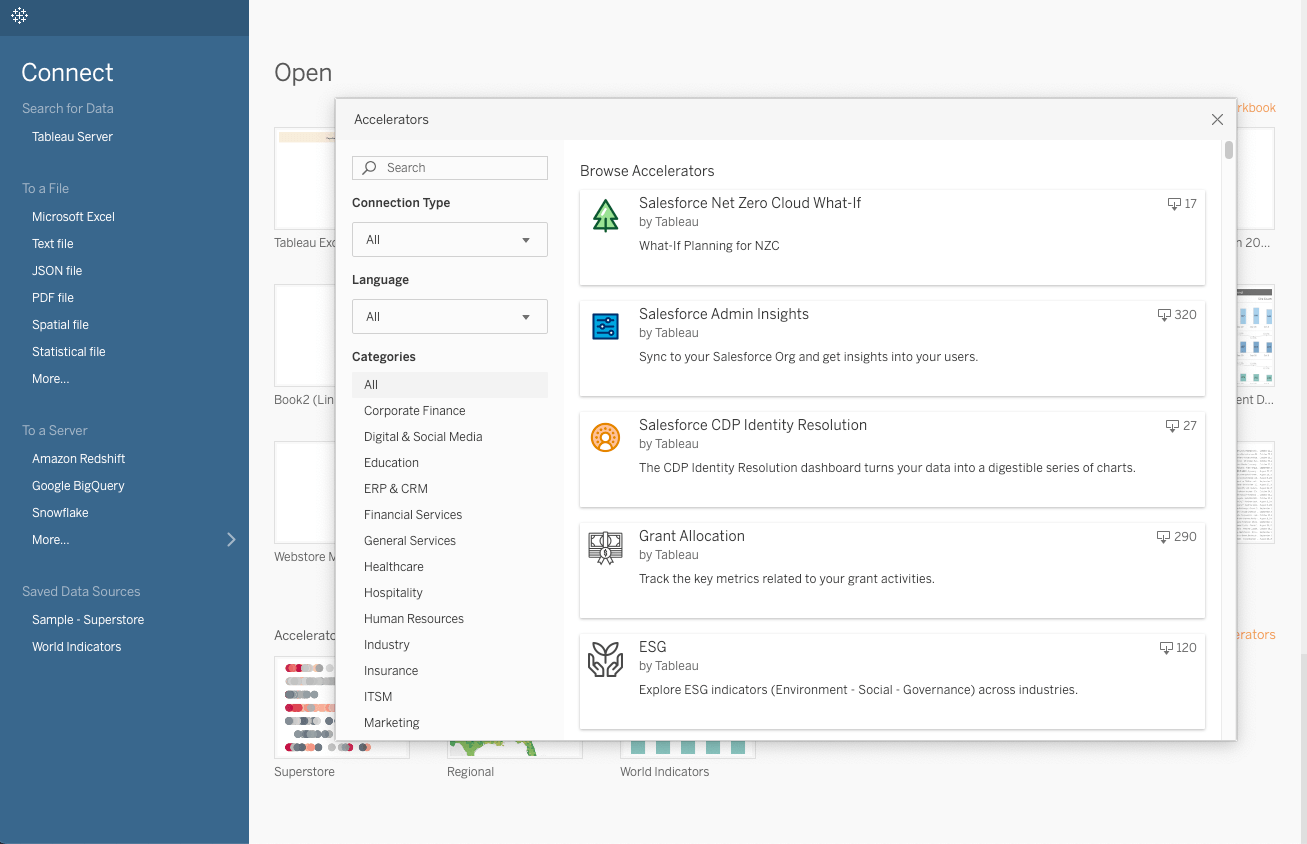
Imagine if the groundwork for analysis was already laid out for you. Tableau Accelerators make that a reality.
Accelerators jumpstart your journey to actionable insights with ready-to-use dashboards built by experts. And you can leverage these trusted offerings from the Tableau Exchange directly where you work in Tableau Desktop.
Click “More Accelerators” to explore offerings for any use case. Search and filter to narrow your selection. And you’re already on your way.
To further level up your dashboards, drag and drop Extensions from the Objects menu to add unique features to your dashboards or integrate them with applications outside Tableau.
Autosave in the browser
The feeling of losing your work after making progress can be devastating. Even if you remember what work you need to redo, it still takes time to rebuild what you lost.
Autosave ensures that you can resume work from where you left off, every time. Edits are continuously stored in a draft until you’re ready to publish. For extra reassurance that autosave is on, make sure it says “All changes saved” by the Publish button.
Now you can work without fear of losing your progress, breaking things, or sharing prematurely. Instead of worrying about the last time you saved, stay in the flow of analysis.
Thank you, Tableau Community!
You inspire us every day, and your partnership and support make each Tableau release possible. We couldn’t do this without your incredible expertise, creativity, and dedication to using data to solve problems.
Visit the Ideas forum to see all the capabilities that have been incorporated as a result of your brilliant suggestions. And don’t forget to upgrade to the latest version of Tableau to start using all these exciting new features.
Related Stories
Who is Einstein Copilot for Tableau for?
 April 10, 2024
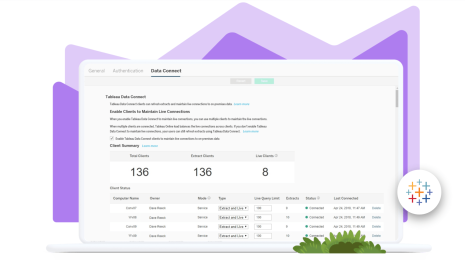
Securely Access and Analyze All of Your Data with Data Connect for Tableau Cloud
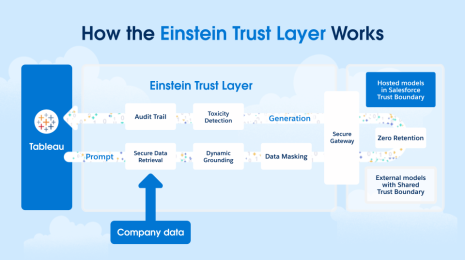
How Can I Trust Einstein Copilot for Tableau?
 April 2, 2024
Subscribe to our blog
Get the latest Tableau updates in your inbox.