Quickly create benchmarks and model guidance
Analysis of your natural resources portfolio at all stages of development is a challenging task. Common research tasks can take days to complete due to the complexity of the business environment, the complex subject matter, and the sheer volume of information available.
Tableau allows your teams to quickly identify resource allocations, reservoir output trends, and profile patterns using visual analysis – all within a powerful application suite that can be used by anyone who knows Excel.
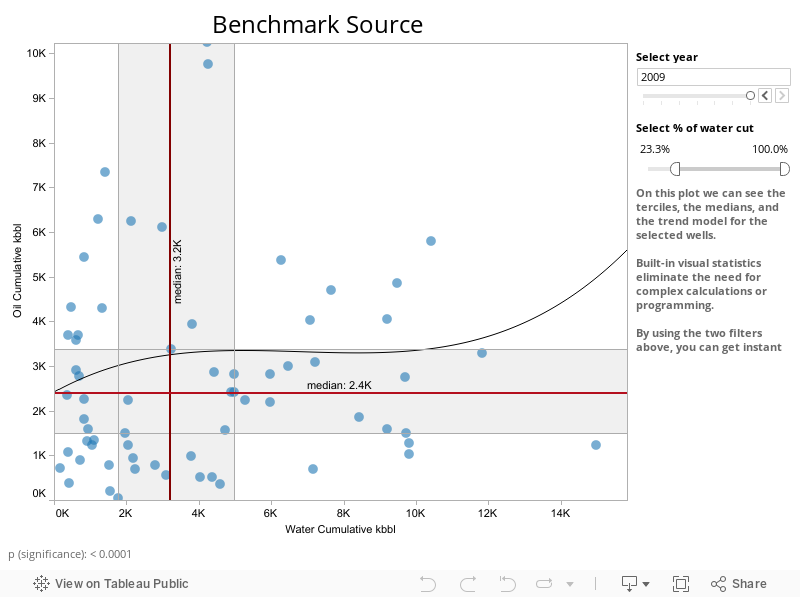
This view shows an overview of your well and reservoir portfolio with built-in “reference lines.” These lines can include basic banding such as six sigma distributions, or they can be customized to your needs. Imagine being able to apply an injection model – for example Co2 versus H2O - to this view to see which wells responded with more or less water or oil output.
As you explore, you will naturally want to apply filter criteria – available on the dashboard directly - to see the actual data versus your expected benchmarks. Tableau eliminates the need to create complex statistical calculations by providing visual analytics for these calculations.