Motivate sales teams by modelling commission rates
Managing a sales team is a lot easier when you have the right insights at your fingertips. Modelling results is simple with Tableau. Using this visualisation, you can quickly explore the relationships between compensation type, commission and quota attainment for a specific group of salespeople, and see the impact on the company as a whole. You can manipulate these variables live to see how results might have panned out differently.
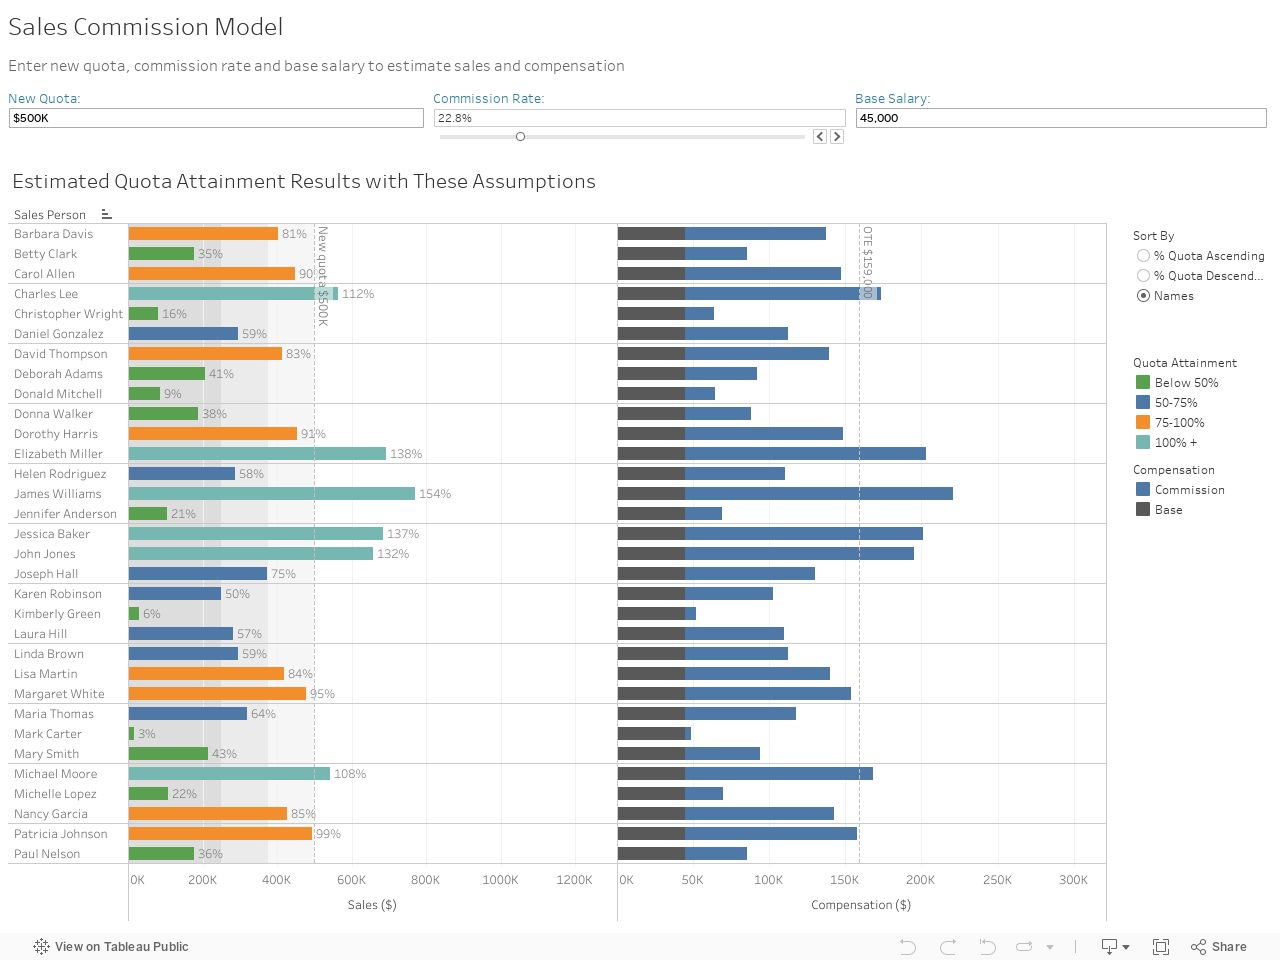
Tableau your mind. Daily.
Get the Viz of the Day delivered right to your inbox from Tableau Public, the world’s largest repository of data stories.
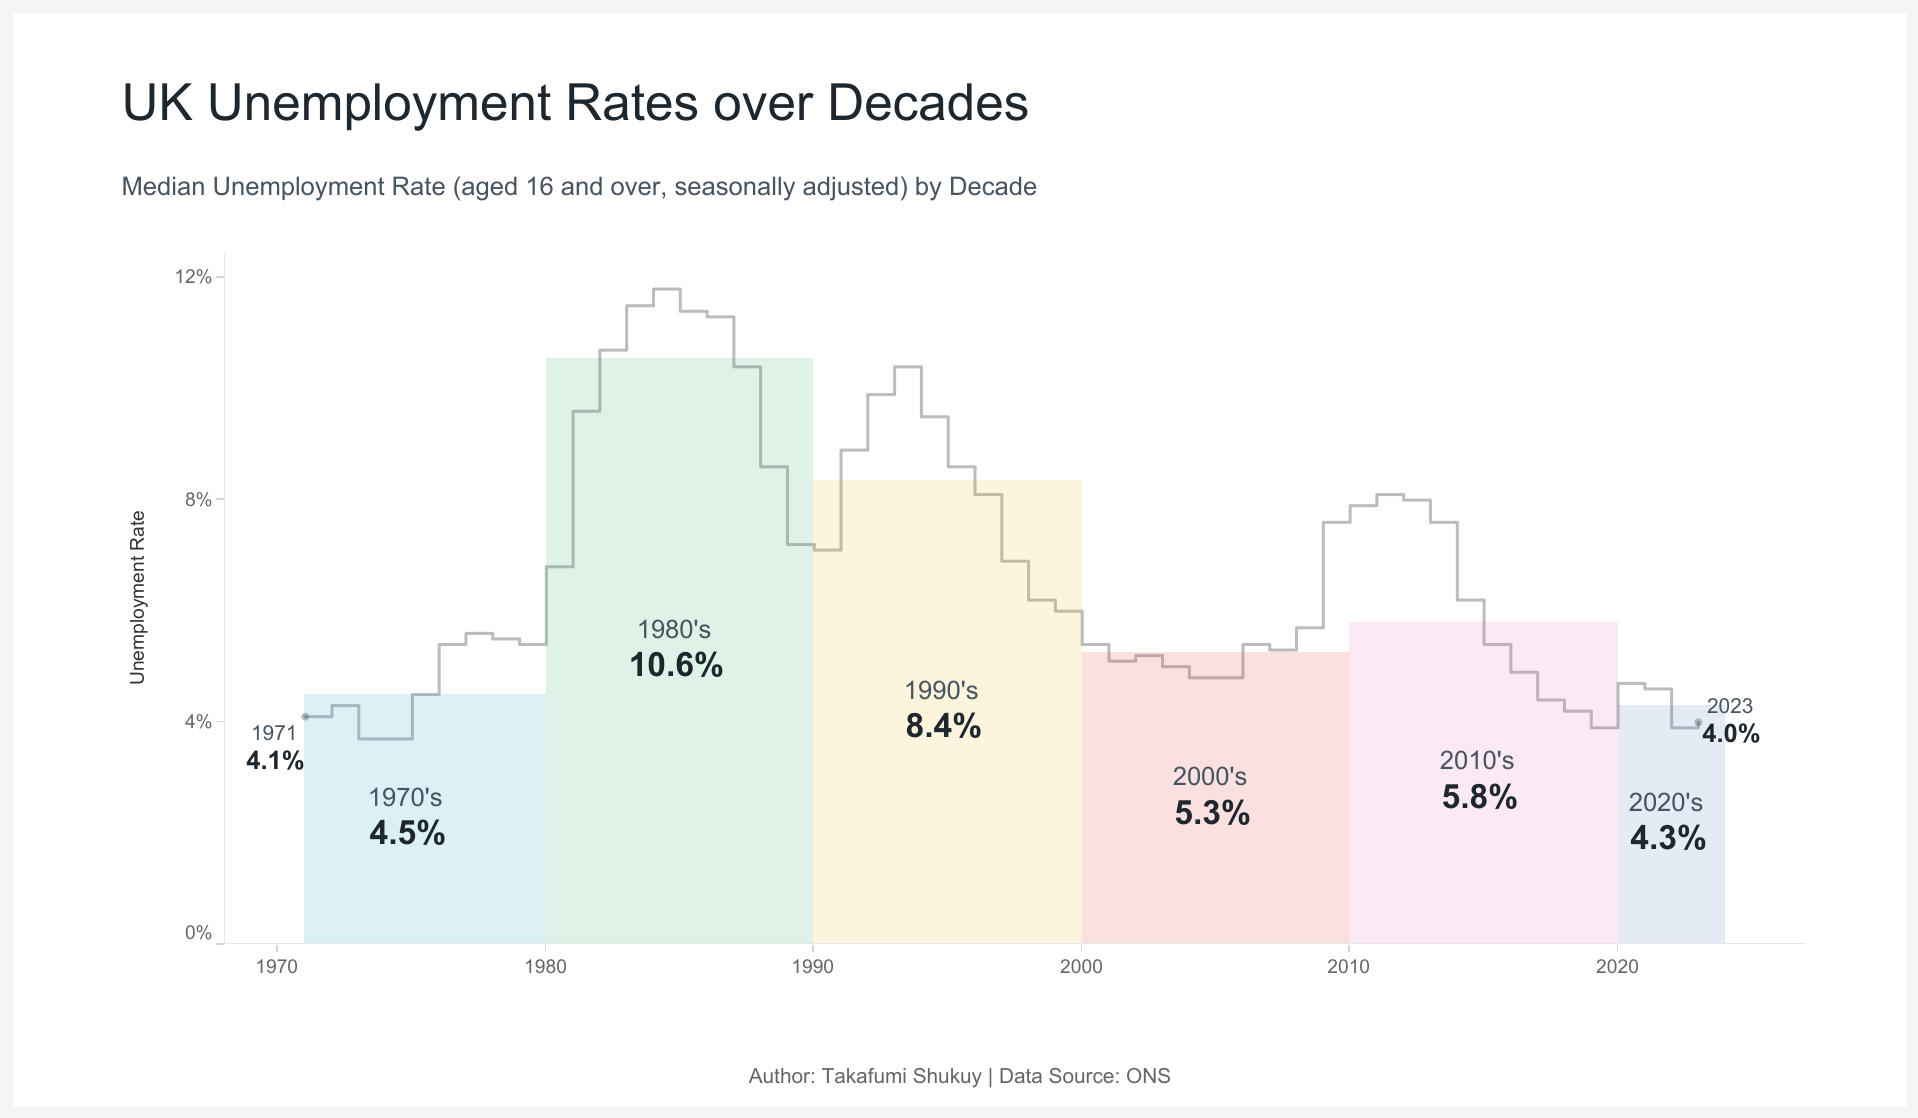
UK Unemployment Rates over Decades
This #VizOfTheDay by Takafumi Shukuya visualizes the unemployment rates in the UK since the 1970’s. This #MakeoverMonday entry marks Takafumi’s 300th viz on Tableau Public. Make sure you explore his collection.
Interact with the viz